It can sometimes be a good idea to have a debugger tool for application development to help with certain types of issues and make life easier. When programming a AAA game, it is almost a necessity. Odds are, you’ll want some kind of tool to handle logging of bugs to a database after a crash or when an assert fires. While that logic can be coded into an exception handler within the application itself, it is never an ideal situation to rely on the behavior of a faulting application. If there is a stack overflow, for example, then performing any logic without a stack quickly becomes complicated. Errors fired right before a crash may not have time to be processed, so offloading those to another application is helpful too.
Luckily, it is relatively simple to set up a debugger tool with minimal effort to handle these things. Rather comprehensive functionality that allows for two-way communication between the application and your debugging tool is easily achievable. With a whole team using the tool when running the application, bug creation is streamlined for all of them and will be performed in a consistent manner to always include logs and other desired information. There are a few technical hurdles to creating such a tool that are complex on the surface, but this post should serve as a sufficient walk-through to guide anyone through them. Together with the code sample, you should be able to get one up and running pretty quickly.
The code sample is located here:
https://github.com/Eagleheart/DebuggerTool
Note that if you want to compile WinDebugQT yourself, will need to install QT from here for the UI and set it up within VS. I am using C:\Qt\6.2.2\msvc2019_64 and the installer likely doesn’t select the msvc version by default, so you will have to make sure to check the box to install it.
The implementation of this tool uses the Microsoft Console Debugger (CDB). It is also possible to use the very similar Microsoft Kernel Debugger (KD). KD will pick up system-level messages so is preferred for Xbox development and remote PC debugging, but CDB is used for local PC debugging as KD cannot be used locally. This is because it locks up the entire system it is debugging. But both respond to nearly all of the same commands that are relevant to us here. The differences between them can be found within the Microsoft documentation. Both can be installed by downloading Debugging Tools for Windows.
Either debugger will prompt when exceptions are hit and allow us to perform our needed functionality. Much of this functionality is obtained through register manipulation of the debuggee application that allows us to trigger callbacks within the debuggee code. Our tool allows us to provide an alternate stack to the faulting application at the time of fault so that it can reliably run code even in the event of a stack overflow.
The first step is to have our tool launch CDB and have that connect to our application. We will then use pipes to communicate with CDB from our tool, processing its output and sending input commands to it. There is a guide for launching an application from a tool with pipe communication here, or just refer to my basic OOP implementation of the same thing in the sample code. For simplicity, I’ve simple had the debugger tool launch the application to debug and then tell CDB to connect to it. I added a small sleep at the start of the debuggee application so that CDB will have time to connect before it begins further execution.
static char dummyStr[] = "DummyProgram.exe";
m_DummyProc.Start(dummyStr, false, true);

std::string cdbStr(std::format("C:\\Program Files (x86)\\Windows Kits\\10\\Debuggers\\x64\\cdb.exe -g -o -p {}", m_DummyProc.GetProcessId()));
m_CdbProc.Start(cdbStr.data(), true, false);
And that’s it to have CDB connected! You’ll then want to start an update loop to poll for CDB output to know when to respond to something. You’ll typically receive an immediate prompt on connection, which you’ll want to handle by sending a g command to resume execution of the debuggee.
WriteToCdbProc("g\n");Now let’s look at our debuggee code. It needs handling added to it so that we’re able to achieve the two-way communication we want here. For this example, the debuggee is just a dummy application that will do this setup for demonstrative purposes. Here is all of the main file, which is the entirety of the program aside from a short assembly file:
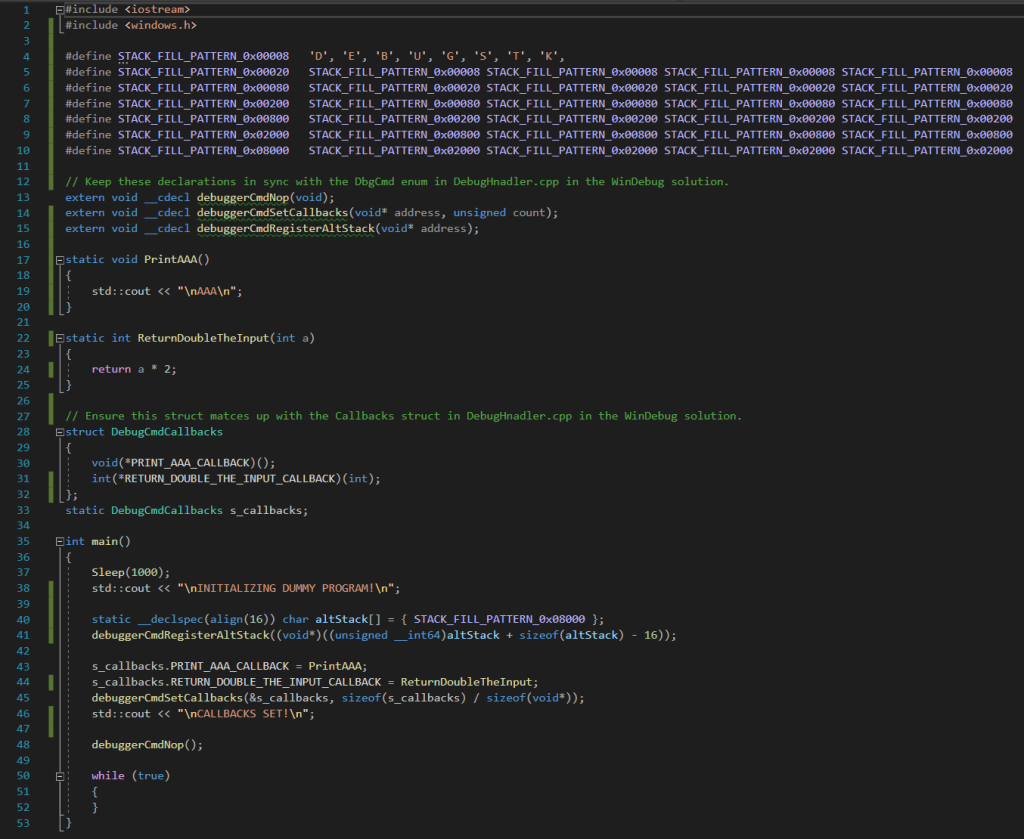
Defines are utilized to create a buffer that stores a repeating string to use for our alternate stack. While not a necessary step, it’s nice to have a pattern there for debugging purposes. An alternative stack can overflow as well! The next section declares the commands that our application can trigger in the debugger tool. They are defined in a separate assembly file – but don’t worry, it’s a very short file and easy to learn the few commands needed. I’ll go over that later.
Next we define the two callback functions that I’ve set up for testing purposes. These are functions the debugger tool can trigger the application to run. The first one simply prints the string “AAA” and the second one returns double the value of the int it receives. The pointers to these two functions are stored in a struct so that we can pass them to the debugger tool all at once. After the definition of that struct, we have the main function.
As mentioned before, we first sleep to give CDB time to connect after it has launched. We create the alternate stack buffer and pass its location to the debugger via the debuggerCmdRegisterAltStack command. Then we fill in our callback struct and pass that to the debugger as well via the debuggerCmdSetCallbacks command. Then we fire a nop command and enter an infinite loop. Now for the assembly file.
In order to compile this asm file once it is included in the project, you have to activate a project setting. For VS 2019: Right click the project from Solution Explorer, go to Build Dependencies -> Build Customizations… and check the “masm” box. This should allow the compilation and link it in properly with your main file.
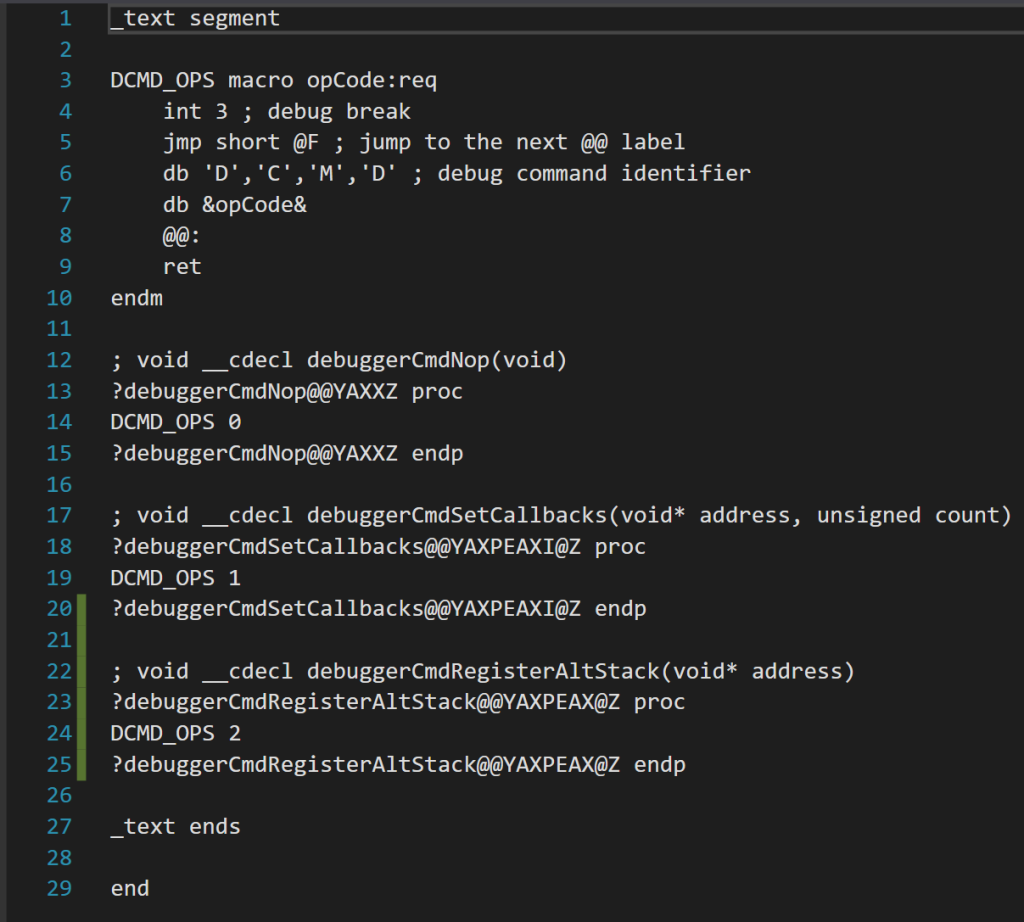
The crux of this file is a macro that defines a command. The macro is named DCMD_OPS and has a required parameter called opCode. Each command will have its own opcode for the debugger tool to identify it. Anything following a ; character in masm is a comment. First we do an int 3, which is just the signal for a debug break. This will cause CDB to prompt our debugger tool on how to handle it. Then we jmp to a return statement, ending the execution of the function.
But what about the other two lines!? Well, the db command places bytes directly into the executable. They are not runtime commands, but will rather execute when you compile your C++ file and the executable is assembled. All they are doing is providing unique information for each command near the exception that will fire when the command is called in C++ code. First we place the letters DCMD to identify that this is a debug command, then we place the opcode so we know which one it is. The debugger tool will look up this information when it processes the debug break.
Then each function defined here merely needs its own block to call the macro and pass in the opcode. The proc command defines the function of the given name. How do we get the exact name of our functions to define though? As you can see, the symbol name has a bit more fluff around it than in the C++ code. That is just how the Microsoft compiler decorates symbol names. You don’t need to know the inner workings of that. All you need to do is compile without the function defined and it will give you an error code showing the name it is expecting:

That covers everything for the application being debugged! Now let’s see how our debugger tool handles commands and fires off callbacks. This logic is all in DebugHandler.cpp in the sample code. We first detect a prompt from the CDB output pipe by checking when it outputs a string that ends with the “>” character that is sent when hitting an exception. The program will then be paused and be waiting for our input.
At this point, we call DebugHandler::HandlePrompt. This sends the db command “db @rip L8” to CDB which will print out the next 8 bytes located at the current instruction pointer. We check if these 8 bytes contain the “DCMD” signature we wrote to the executable in the assembly file earlier. If they do, we know we are processing a debug command sent by the application and then retrieve the opcode (which will be the 8th byte printed out) to know which command the application wants us to perform. We then wait for another prompt before continuing with our command logic.
For debuggerCmdNop, we simply go handled. For debuggerCmdSetCallbacks and HandleDbgCmdRegisterAltStack, we use the r command to print out the value of the rcx and rdx registers – this is where arguments are stored when the debuggee application calls the cmd function. This behavior is documented here. Since the debuggerCmdSetCallbacks param stores the address of a struct, we use the dq command to print out the quadword pointer values at that memory location to obtain the address of each callback function.
That’s pretty much it for the application triggering commands within the debugger tool. Simple, right? Now for callbacks in the application. Those are a little more tricky, but essentially we just modify all of the registers in order to simulate a function call and then send the go command! Once that completes, we have to restore the previous register values in case they were still being used by the function that was executing.
Before we can fire a callback though, we have to be at a CDB prompt to issue commands. We can do this by sending Ctrl+C commands to the CDB application. At least, for PC we can. On Xbox, there is unfortunately a bug where CDB commands will not work once pausing the application in this manner. That functionality isn’t really necessary though. For most cases, we can merely fire the callbacks after having received a debug command from the application when a prompt is readily available as we do in this sample!
Let’s take a look at DebugHandler::FireCallback. First, we use the r command to print out all of the current register values and store them in a struct. Unfortunately, to get the XMM registers in a usable format we have to print them out individually…so that’s 16 additional commands sent to CDB for those. Anyway, once we have them so we can restore them later, we now have what we need to simulate the function call! And it doesn’t take much!
// Set rip to the callback address, new rsp and efl values, parameter arguments, and go handled to fire the callback in the debuggee code.
// Also write 0 to the stack pointer to continue with logic after the callback completes.
WriteToCdbProc((
                std::string("r rip=0x") + ripStream.str() +
                ";r rsp=0x" + rspStream.str() +
                ";r efl=0x" + eflStream.str() +
                ";r rcx=0x" + rcxStream.str() +
                ";r rdx=0x" + rdxStream.str() +
                ";r r8=0x" + r8Stream.str() +
                ";eq " + rspStream.str() + " 0" +
                ";gh\n"
                ).c_str());
We set the instruction pointer (rip) to the address of the callback function we obtained from the debugger application earlier. We write the params we want to send to the callback (if any) in rcx, rdx, and r8. We pass in a modified FLAGS register (efl) value that is the same as before but with the direction flag cleared in case it is somehow set.
The most complicated thing to set is the stack pointer (rsp). We need to modify this because we have just begun a new function. We start with the current rsp (or use the alternate stack address instead if that has been set). Then we align it to 16, since that is a requirement unless in a function prolog or epilog and we might have been in one. Then we decrement 8 bytes to store the return address and another 32 bytes for the shadow space, or parameter home space, that it is required a caller reserve for a called function. Remember, the stack grows downwards.

The shadow space corresponds to the “A register parameter stack area” in that diagram and the return address is right below that. So, our new RSP will be pointing right where the “call B” line is. And since our new RSP is pointing directly at where the return address is meant to be stored, we use the CDB eq command to write out a 0 quadword pointer there. This will cause it to attempt to return to address 0 when the callback is complete, which will cause an exception/prompt so control will return back to our debugger tool.
Note that we don’t need to put anything in the shadow space. That area is managed by the called function itself, so it will use it for storage as needed when the function executes. Once control returns back to our debugger tool, we print out the value of RAX to get whatever return value the callback function stored there. Then we use the r command once again to set the value of all the volatile registers back to what they were before we fired the callback! As far as the application is aware, nothing ever happened and it will resume normally from where it was. Then we can continue with further logic or go handled to resume execution of the application.
The nonvolatile registers will have been automatically restored by the callback function prior to it attempting to return to address 0 and giving the debugger back control, as it is the responsibility of a called function to do so. The volatile registers, while expected to be destroyed on a function call, cannot be left changed since the calling function didn’t know it was going to call anything and thus hasn’t saved them anywhere!
And that basically covers everything. As you can see, the sample code is able to fire commands in the debugger tool to store all the needed values and the debugger tool is able to trigger the debuggee to print out the string “AAA” and to have it double a value to get returned back:
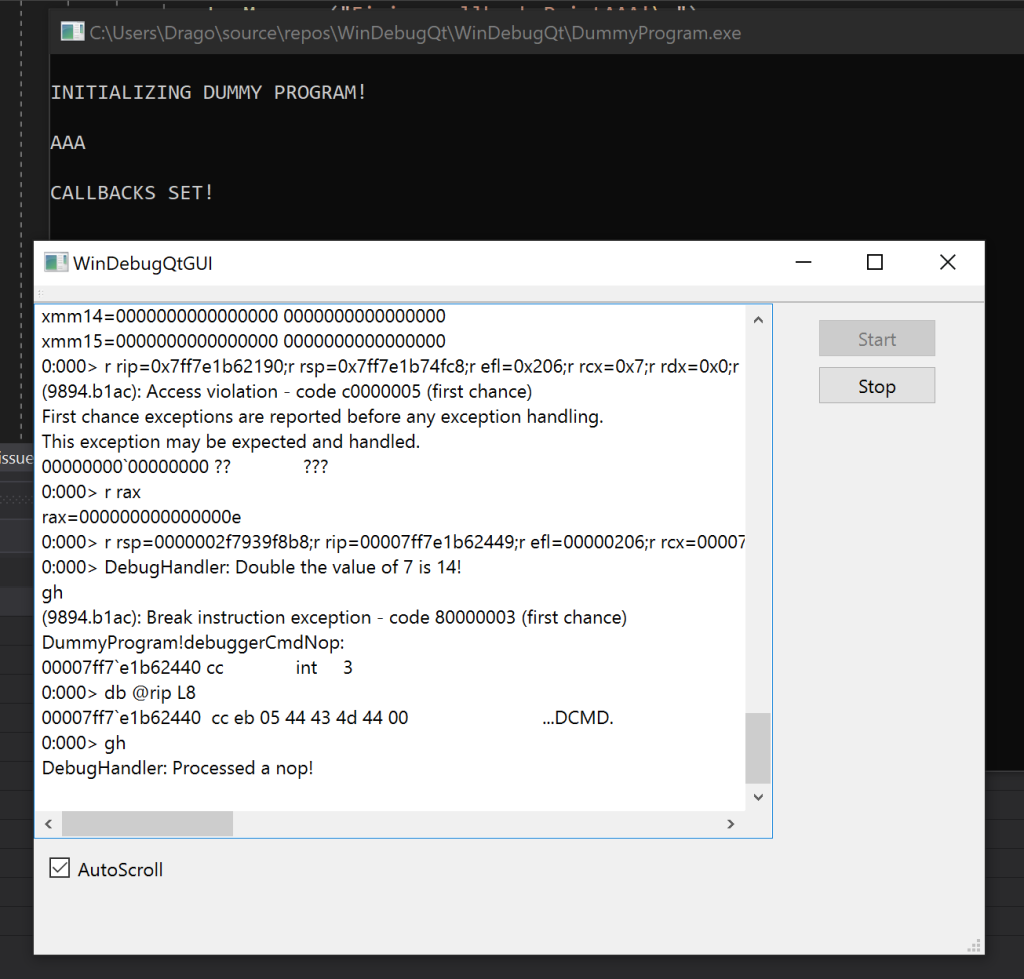
The dummy program then sits in an infinite loop until stopped by the debugger tool. Of course, a real application will be doing whatever logic it is meant to be doing instead. The debugger can signal the application to flush logs on a crash and perform any needed actions prior to the debugger creating a bug in some database and posting the logs to it!